Wednesday 15 April 2009

When stochastic search beats direct methods

The central problem of reinforcement learning is to fit the parameters of an agent's policy in order to make the agent chose "good" decisions according to some unknown objective.

Let's consider a very simple case. We have an MDP which is basically stateless. So to say, all the world is doing is to map the actions of an agent directly to a reward. Consider this function to be a mixture of two gaussians, with one mode at -3 and one at 3. Say we pick a single mode gaussian as a model of the world.

After fitting our model to our data, gathered via a rollout, weighting it by the reward - we will get a gaussian that has a mode somewhere around 0.

A better strategy for an agent would be to just stick to one of the modes. Even though this model of the world is not more correct, it does lead to a better policy. Picking 0 as an action will lead to a reward of approximately zero while always picking -3 or always picking 3 will always return 0.5 as a reward.

Under the assumption of a single mode gaussian and via the maximum likelihood approach, a non optimal solution is picked.

Of course, there are superior methods. For example, one could estimate the gradient and just move up to one of the modes. But what happens if the gradient information is incomplete? This can happen if our world has time dependencies which are not modelled (e.g. non markovian environments). It can also happen if our observations are not complete but only partial (as in POMDPs). In that case, direct methods are prone to fail, again.

Imagine our world to be only accessible through a proxy, which happens to turn the complete state information into an observation via a many-to-one mapping. For example, two different states s and s' map to the same observation o. However, the rewards r(s) and r(s') are completely different, say -1 and 1. In that case our sampling will lead to a completely wrong impression.

Stochastic search does not suffer from this problem. A direct method uses an approximation of the world's dynamics consisting of the observations and the rewards as well as the current agent's policy in order to generate a new (hopefully better) policy. A simple hill climber uses only the current policy and its expected reward. Since the non-use of local information does keep it from making wrong decisions due to wrong information, it is in theory more robust if the environment has a lot of wrong local information.

Friday 13 February 2009

Bash Job Management Essentials

Did you ever wish your program had a pause button? I did so regularly. I regularly have to do lengthy calculations, for example for evaluating some heuristics for an optimization problem such as Maximum Independent Set or Matchings. A typical program could look like this:
for all benchmark graphs G:
  for all algorithm variants A:
    for k in [2, 4, 8, ..., 128]:
      Execute A on G with the current value for k
Now if this computation takes 20 hours and I'm running this on my laptop, one of the CPU cores is hogged and the fan goes berserk. So what happens if I want to take my computer somewhere else or view a movie? As it turns out, I can simply suspend the machine and after waking up the program will continue to run. This already solves the first problem and shows that the operating system can suspend my program out of the box. The bash shell (and I'm sure other shells, too) helps me with the second problem: It is able to do basic job management. Consider the following command sequence. This lists my temporary directory and pastes it through less. less will wait for my input.
$ ls /tmp | less
Now, I press Ctrl+Z to suspend less:
[1]+  Stopped                 ls /tmp | less
Neat! How do we get back the listing. With fg %<job number>:
$ fg %1
We can also have multiple jobs:
$ ls /tmp | less
Ctrl+Z
[1]+  Stopped                 ls /tmp | less
$ ls /usr | less
Ctrl+Z
[2]+  Stopped                 ls /usr | less
The command job gives us a listing of the current jobs:
$ jobs
[1]-  Stopped                 ls /tmp | less
[2]+  Stopped                 ls /usr | less
There is one gotcha: If you use the bash command time, it will display the passed time when you suspend your job and not print the remaining spent time after you restart it again:
$ time ls /tmp | less
Ctrl+Z
[1]+  Stopped                 ls /tmp | less

real 0m1.139s
user 0m0.001s
sys 0m0.003s
manuel@coxorange ~
$ fg %1
ls /tmp | less
Ctrl+Z
[1]+  Stopped                 ls /tmp | less
In this case, use time on fg %1:
$ time ls /tmp | less
Ctrl+Z
[1]+  Stopped                 ls /tmp | less

real 0m0.723s
user 0m0.001s
sys 0m0.003s
manuel@coxorange ~
$ time fg
ls /tmp | less
Ctrl+Z
[1]+  Stopped                 ls /tmp | less

real 0m0.913s
user 0m0.000s
sys 0m0.000s

Tuesday 16 December 2008

Pitfall with distutils + OpenGL on Mac Os X

This is mainly here as a reminder to myself and anyone else who might fall into this. The scenario is as follows: I want to compile a C Python extension that uses OpenGL on Mac Os X. My setup.py file looks something like this:
#!/usr/bin/env python2.5

from distutils.core import setup, Extension

module1 = Extension('foo',
sources=['foo.c'],
extra_link_args=['-framework OpenGL'])

setup(
name='foobar',
version='0.1',
description='This is foobar!',
ext_modules=[module1]
)
However, when I build this with python setup.py build and then try to import the module with python -c 'import foo' , I get the following error:
ImportError: dlopen(./foo.so, 2): Symbol not found: _glBegin
Referenced from: .../foo.so
Expected in: dynamic lookup
How can we fix this? Take a look at the following file:
#!/usr/bin/env python2.5

from distutils.core import setup, Extension

module1 = Extension('foo',
sources=['foo.c'],
extra_link_args=['-framework', 'OpenGL']) # Note the "', '"

setup(
name='foobar',
version='0.1',
description='This is foobar!',
ext_modules=[module1]
)
So, the '-framework OpenGL' has to be given as two parameters for distutils. Nice to know.

Wednesday 13 February 2008

Gaining speed with Weave

Python is slow in terms of execution speed. Period. It is fast enough for most tasks out there, but when it comes to number crunching or manipulation of lots of objects, you can hear the interpreter grind its teeth.

Python advocates have a lot to say on how to handle these situations. The most common is "you can always rewrite that particular part of code in C". There are other recommendations: "Just import psyco", "Try to write your whole app in RPython", "Pyrex is impressive" and so on.

All of these possibilities do have some additional requirement, though. You will have to learn how to use these tools. Being fluent in Python alone will not be enough.

The other day I had a very narrow bottleneck in my Python code. It was all about checking what the first ball of a couple of balls is, in which a given n-dimensional point lies. "A couple" stands for several millions in this case; let's call it N.

The loop was like this:

for i, ball in enumerate(balls):
  distance = point - ball
  if dot(distance.T, distance) <= radiusSquared:
        return i

If you know scipy, this will be easy stuff for you. If you don't: it's just measuring the distance from the query point to the center of a ball and checking wether that distance is greater or less than the radius of all balls. The function returns as soon as it has found one ball.

The tricky point about this is, that the Python interpreter will make a for loop over N numbers and call a builtin (dot) in every loop. Once the builtin is called, Scipy's nature as a C extension speeds things up.

But what if the whole for loop could be written as a builtin? That's what we could do by writing it as a C extension.

Instead, I decided to look around and weave sounded interesting: Inline-C++. I figured that rewriting the above loop in C++ would be fairly easy. I copied the skeleton from scipy's PerformancePython webpage and just put in my code:

nBalls, dim = balls.shape
radiusSquared = self.radiusSquared

code = """  
    return_val = -1;
    for (long i = 0; i < nBalls; i++)
    {
        double distance = 0.0;
        for (long j = 0; j < dim; j++)
        {
            double diff = balls(i, j) - point(j);
            distance += diff * diff;
        }
        if (distance <= radiusSquared) {
            return_val = i;
            break;
        }
    }
"""

variables = 'point', 'balls', 'nBalls', 'dim', 'radiusSquared',
result = weave.inline(
    code, 
    variables, 
    type_converters=weave.converters.blitz, 
    compiler='gcc')
    
return result if result != -1 else None

The amount of lines grew quite a bit, but it still fits on a single screen in my editor. It's actually quite simple, but we can expect to get some benefits of this:

  • We can expect to run the above code completely from the L1 cache
  • We can expect all our data to be at least in the L2 cache

And when code greatly decreases its cache misses, things start to become really fast.

In this case, speedup was of about several orders of magnitude. The function itself was faster by factor 2**12; the whole program started to run 60x as quick as before.

Furthermore, there were no caveats. Everything worked out of the box. On the first call of the function, the above code was compiled, which slowed down the first call. But once it is compiled (and weave caches compiled code over several interpreter sessions), things get pretty fast.

Sunday 30 September 2007

C++ - Beware What Lurks Beneath The Surface

C++ is a great programming language. It allows you to mix the most important programming paradigms like object orientation as well as generic, functional and structured programming. Another nice aspect is that the compilers are efficient and with some black template magick, you get some of these things for almost free at run time.

However, one of the greatest features of C++ can hurt you: When you write your own classes, they meld into your source code as if they were built-in types most of the time. However, always remember what is going on under the surface.

Today, I was hacking away at an OpenMP parallelization of a shortest-path algorithm (Highway Node Routing by Dominik Schultes) for my student research project. The algorithm needs to perform a lot of Dijkstra single-source shortest-path searches.

The existing code encapsulated the Dijkstra search in its own object class and the construction code had a single Dijkstra object to perform these searches:

class ConstructionClass {
public:
  ConstructionClass(Graph *g)
    : _graph(g), _dijkstra(g) {}
  
  void doConstruction() {
    // ...
    for (NodeID u = first; u != last; u++) {
      d.performSearchFrom(u);
      // ...
      d.clear();
    }
    // ...
  }

private:
  Dijkstra _dijkstra;
  Graph *_g;
};

This part of the parallelization comes almost for free: Use a Dijkstra object for each thread and you're done. OK, so I ended up with the following code in ConstructionClass::doConstruction() before adding #pragma omp parallel.

void doConstruction() {
  // ...
  for (NodeID u = first; u != last; u++) {
    Dijkstra d(_graph);
    d.performSearchFrom(u);
  }
  // ...
}

So far, so good. I compiled the program and let it run and the construction time went up from 2 seconds to more than 2 minutes! What was going on?

The problem was that the construction/destruction of the Dijkstra object for every loop took long: Whenever you do not use the new operator, you allocate objects on the stack and they get freed whenever the stack shrinks so it does not include the object any more.

Side node: Note that Java cannot do this — you cannot control where your object get created and because of garbage collection you cannot predict when the object is actually freed.

However, writing the code in C++ hid that fact from me since custom types look almost as built-in types. You could get the same problem with any class that does complex things in its constructor and destructor.

For example, the following two pieces of code are equivalent and memory allocation is expensive!

struct Table {
  Table(int size) {
    arr = new int[size];
  }
  
  ~Table() {
    delete [] arr;
  }
  
  int &operator[](const int index) {
    return arr[index];
  }

  int *arr;
}

// ...

for (int i = 0; i < MAX; i++) {
  Table t(MAX);
  // ...
}

and

for (int i = 0; i < MAX i++) {
  int *arr = new int[MAX];
  // ...
  delete [] arr;
}

Wednesday 26 September 2007

Ruby's Multithreading: On Processes And Threads

Note that I made a grave error of thinking before writing this article: I forgot the copy-on-write page sharing of modern Unices. I added two paragraphs to this article that should clarify the point. Thanks for your comment, Alex.

Please note that I do not want to critizize Jason here. I am simply picking up this point from his presentation as a motivation of a topic that I wanted to write about since the issue with Ruby and threads occured. Also note that I actually like Ruby a lot and I am using it in almost all of my projects either for support scripts or as the main programming language: I am not anti-Ruby.

Today, the Riding Rails weblog linked to the slides of Jason Hoffman's tutorial Scaling a Rails Application from the Bottom Up in one of their entries.

While I do not want to doubt his expertise on scaling applications — he is the successful founder of Joyent, TextDrive and Strongspace — I stumbled over slide 115 of his tutorial which says

  • I like that Ruby is process-based
  • I actually don’t think it should ever be threaded
  • I think it should focus on being as asynchronousand event-based on a per process basis
  • I think it should be loosely coupled
  • What does a “VM” do then: it manages LWPs
  • This is erlang versus java

I have not attented his tutorial and thus I might misunderstand him. I might not be proficient enough in system and computer architecture. Nevertheless, I am wondering about the scalability of pure processes. There was a quite a discussion about Ruby and real kernel multithreading some time ago, but I did not read an article covering the same aspect that is discussed here: Memory Bus Saturation.

Thread, Process and Address Space

Let's recap the textbook definitions of threads, processes and adress spaces. Note that they do not necessarily map to what vendors call them or are consistent over all text books.

  • A thread is pure activity, i.e. the information about the current position of execution (instruction pointer), the registers and the current stack.
  • An address space is a range of addressable memory that is only accessible by activities that are allowed to read/write from it.
  • A process consists of an address space and one or multiple threads.

OK, what does this mean? Each program that you run on your computer runs in its own address space if you are using a modern operating system, for example your web browser and your email client. Both applications (processes) appear to execute concurrently, i.e. you can download a web page and send an email at the same time. Even within each process, you can have multiple activities — threads. For example, your browser might download two images from a web site at the same time.

threads in a browser and email client

Your operating system executes the applications seemingly concurrently by using time slicing, i.e. assigning each process/task to the CPU for a short time and then assinging the next one.

Where is the real difference between processes and threads? Well, two threads within the same address space can access the same memory address at the same time. For example, both of the threads downloading an image can access the list of images for a website document.

adress spaces are protected

The thread from your email applications cannot access this list. If the web browser and email client want to communicate, the operating system has to provide means for this. Communication could be done through files, pipes, sockets or message passing within the operating system.

User and Kernel Level Threads

Whee, that were a lot of new terms, eh? I have two other ones for you: kernel level threads and pure user level threads.

user level scheduler

A kernel level thread (KLT) is a thread that the kernel is aware of, i.e. the kernel can decide which KLT will be schedule (assigned ot the CPU). Pure user level threads (PULTs) are not known to the kernel: One or more PULTs may run on top of a KLT and the kernel can only schedule the KLT. The decision which of the PULTs is scheduled is left to the user level scheduler in your application.

There are some tradeoffs between PULTs and KLTs and there are even hybrid models but the following problem remains: The kernel can only schedule KLTs to run on a given CPU. If you have more than one CPU/core then the kernel can schedule two KLTs to run concurrently. For example you could decompress two JPEGs at the same time in your web browser if you have two cores on your CPU.

Ruby only offers PULTs. What does this mean? This means that you cannot have one Ruby process with two threads running at the same time. You cannot, for example, let a Rails process generate two differently sizted thumbnails of an uploaded image at the same time. You cannot answer more than one request at the same time without stopping the other thread. You cannot do numerical computations on more than one core at the same time.

Ruby And 64 Core CPUs

So, we are coming closer to the problem that I see with Ruby and the upcoming 64+ core CPUs that DHH would welcome ``any day'' (so would most of us, right?). Try the following: Start the Ruby interpreter and a Rails console with ./script/console. The plain Ruby interpreter uses 1.2MiB and the Rails console session uses 28.42MiB on my Os X box; your mileage may vary.

I have not done any measurements but consider the following: Each of your Rails process needs 1.2MiB of memory for the interpreter and then more propably more than 20MiB of memory for your application instance. Some of this memory will be actively used in the inner loops of your program, let's make a conservative guess and say that each of your processes needs 0.5MiB of the address space most of the time. If you have a 64 core CPU then you need 32MiB of L2/L3 cache to access the memory quickly.

A typical L2 Cache on a Core 2 CPU with two cores is 4MiB of size. We could do some simple calculations and get that by the time, we have this 64 core processor, our L2 cache will have a size of 128MiB. After all, Wikipedia tells us that by 2007/2008 we will have 6MiB of L2 cache for two cores.

However: First, there are some physical limitations to the size of a cache hierarchy since electricity can only travel that fast. Second, as good engineers, we should consider whether we could cut down the memory requirements with sufficiently little work.

How would a multithreaded Ruby help to save memory? Well, the Rails console session used all of its memory by declaring classes and doing some initialization work. Most of this memory could be shared by multiple threads since you normally do not modify your classes on the fly in production systems. Your interpreter could be shared, too. By the estimates above, we could save more than 31MiB of cache for all the stack data we want.

Note that we could also save this memory with processes when forking at the correct time: When a process creates a child process, old Unices copied the whole address space. This is no longer the case: Modern Unices allow read access to the old address space from the new address space. When a memory location is written to by any process, the page will be copied into the new process' address space. Thus, if our Ruby/Rails classes do not change and we fork after Rails' initialization is complete, all of our 64 processes can share the same data.

I added this and the previous paragraph after the original article has been published because Alex reminded me of this fact in the comments. Thanks to him, the singlethreaded Ruby world is all fluffy again — mostly. A multi process system still has some traditional disadvantages like a higher cost of context switching (which could be negligible for interpreted languages like Python and Ruby). Additionally, we can ignore inter-process communication costs since Rails is share-nothing.

If we do not save this memory then we might hit the memory wall: The inner loops of the interpreter will fit into the program cache. However, the interpreter needs a lot of information for each executed line of Ruby code. Simply consider all the data that has to be accessed when a simple message has to be dispatched to an object...

What could happen is that we have to access a very large set of memory positions irregularly. If this happens on every core then we might get 64 cores accessing the bus at the same time because some piece of data is missing. This data might overwrite necessary information about a class in the cache and force this data to be reloaded again... If all cores shared the same data this would not be such big an issue.

Do you think my logic is wrong and my arguments are weak? Do you see a solution or workaround? I would be thrilled to read your comments.

Updates

  • The original definition of a thread was missing that a thread has a stack. Thanks, DocInverter. (2007-09-26 17:39 MEST)
  • Luckily, Alex was smart enough to see what I forgot: Modern Unices do copy-on-write sharing of address spaces when forking. I corrected the article. (2007-09-26 18:05 MEST)

Tuesday 7 August 2007

Hitting The Memory Wall

Acknowledgement (2011-11-21): You should search Google for your blog titles before hitting "publish". When I wrote this article some years back, "hitting the memory wall" was just a term I had read some time earlier and internalized for myself as a standing term, like folklore. This was wrong. There is a paper from 1995 by WA Wulf and SA McKee with the same title: Hitting the memory wall that I was not aware of to this day. Thanks to sam in the comments for pointing this out. Sorry, for being late with the acknowledgement.

You have always ignored the internals of CPU properties like the number of registers, the exact format of CPU words, the precise format of intructions and of course the cache. I know you have (well, let's say I am sure about 99% of you out there). I ignored this for a pretty long time, too, when programming (although I was lucky enough to be forced to learn about the general principles at university).

And it has always been enough for you, right? Your enterprisy Java programs ran nicely, your beautiful literal Haskell programs zipped smoothly along and your Ruby and Python scripts ran with whatever speed the interpreter made possible. Your C(++) programs ran well, too, didn't they?

At least they did for me (ignoring bugs) - until now. I ignored the CPU internals, kept to common programmer's sense and best practice. I made sure my sorting algorithms ran in O(n · log(n)), searching ran in O(log n) and generally made sure that all algorithms algorithms were in polynomial time and the constants in big-O notation were small.

I thought I was happy and no problem would occur to me. And so you might think. Think again.

Ready, set, go...

I was working on parallelizing Counting Sort, a simple integer sorting algorithm that runs in linear time and needs O(n) additional space.

The algorithm is given an array of integers in the range of [0, max_key] and then works as follows:

  • For each integer from 0 to max_key, count the number of occurences in the input array.
  • Then, determine for each of these integers, where the first one will be written to in the sorted array.
  • Third, copy the elements from the input array into a buffer array at the right positions.
  • At last, copy the elements from the buffer back into input array.

Note that the algorithm is stable, i.e. the order within the elements with the same keys is preserved. This property is important for its application in the DC3 algorithm for linear time Suffix Array construction.

1  /* Use the Counting Sort algorithm to sort the range
2   *  [arr, arr + n). The entries must be in the range of
3   *  [0, max_key]. */
4  static void counting_sort(int* arr, int n, int max_key)
5  {
6    // counter array
7    int* c = new int[K + 1];
8    // reset counters
9    for (int i = 0; i <= K; i++)  c[i] = 0;
10    // count occurences
11    for (int i = 0; i <  n;  i++) c[arr[i]]++;
12 
13    // compute exclusive prefix sums
14    for (int i = 0, sum = 0;  i <= max_key;  i++)
15      {
16        int t = c[i];  c[i] = sum;  sum += t;
17      }
18 
19    // copy elements sorted into buffer
20    int *buffer = new int[end - begin];
21    for (int i = 0; i < n; i++)
22      buffer[c[arr[i]]++] = arr[i];
23 
24    // copy elements back into input
25    for (int i = 0; i < n; i++)
26      arr[i] = buffer[i];
27 
28    // copy elements back
29    delete [] buffer;
30    delete [] c;
31  }

Also note that we copy back the elements from the input instead of simply filling up the result array with the keys we determined earlier. The reason for this is that the input array could be an array of objects which are then sorted by a certain integer property/key.

...and crash!

So, where is the problem? Counting Sort! One of the simplest algorithms there is. Taught in undergraduate courses or in school! Can it get simpler than that? Where can the problem be?

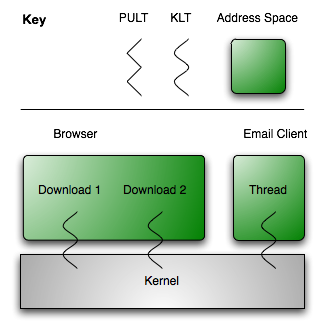
I wanted to parallelize the DC3 algorithm using the shared memory with OpenMP. DC3 needs a linear time integer sorter to run in linear time and the reference implementation uses counting sort for it.

So I threw in some parallel instructions: Line 14-16 were executed for each thread, i.e. every thread got an equally (plus minus one) sized part of the input array and counted the occurences. Afterwards, the threads were terminated and the master thread calculated the "global prefix sums" so all threads got the right positions to write to. Then, lines 21-22 were parallelized again.

The parallelelized code can be found here.

OK, so far - since the sequential work is reduced to memory allocation and the global prefix sum calculation (aka rank calculation) involves very few additions there should not be a problem, right? (Let us ignore the copy-back step for this article.)

So I compiled the source on our Dual Xeon (each with 2 cores) machine with GCC 4.2 and level 3 optimization and ran some benchmarks. The maximum key was set to 127 (i.e. we could sort ASCII strings), the array size set to 16M (i.e. 64GB of data since ints are 4 bytes long on the architecture, filled with random integers) and the number of threads was varied from 1 to 4. The results are shown below (the line numbers correspond to the sequential code not the parallel one):

counting sort benchmark results, n = 228
no. of threads 1 2 3 4
line 14-17 30.20 ms 19.99 ms 29.74 ms 23.88 ms
lines 21-22 100.92 ms 59.61 ms 56.41 ms 55.78 ms

So, we get a speedup of about 1.5 with two threads but afterwards, there is no speedup at all. We should expect a speedup of n with n processors in these two parts since these sections were completely parallelized.

So, what the heck is happening there?

The von Neumann Bottleneck

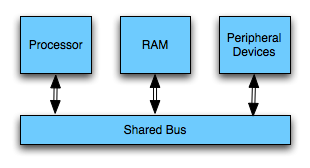
It's the von Neumann Bottleneck, baby! Today's SMP (Shared Memory Processing) systems are still built similar to the von Neumann machine. You were propably taught about it if you have a computer science background:

  • The main memory is accessible via random access and stores machine words.
  • The bus connects main memory, processor, peripherical devices. Only one connected entity can use the bus at any given time.
  • The processor loads data and instructions from the main memory and executes it.
  • There are peripherical devices for input and output (HDD, keyboard etc.)
von neumann architecture without cache

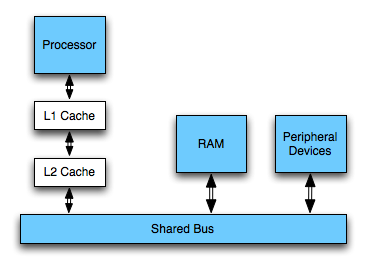
Today's computers do not work directly on the main memory, however, but normally on registers which can be accessed in one cycle. Read and write access to the main memory are cached in a cache hierarchy. The specs of the caches on the given machine were measured to be as follows:

memory hierarch specs for the Xeon 5140 system
- L1 Cache L2 Cache Main Memory
size 32 KiB 4 MiB 8 GiB
latency [cycles] 3 cycles 9 cycles 133 cycles
latency [time] 1.28 ns 3.94 ns 56.95 ns

Additionally, the memory bus bandwidth in the system is 6.4 GB/s (however, as usual with bandwidth you will not be able to actually transfer more than half of that data per second in a real system).

von neumann architecture with cache

So let us see if we can explain the behaviour with the knowledge about the architecture and these numbers in mind.

Lines 14-17 are executed 224 times in total and because ints are 4 bytes wide, this makes 226 bytes = 64 MiB transferred from memory if we only consider arr[] - c[] is small enough to fit into the processor's cache all the time (even one copy for each core).

With one thread (i.e. one processor working), 64 MiB get read in 30 ms which means that 2.133 GiB/s were read. With two threads working, the 64 MiB get read in roughly 20ms which manes that 3.2 GiB/s were read - the memory bus is saturated, our algorithm gets memory I/O bound and has to wait for the slow SD-RAM.

A Strange Phenomenon

Now, let us try to transfer that calculation to lines 21-22 - it should be pretty easy now. Again, we can assume that c[] can be kept in the level 1 cache all the time. This leaves reading arr[] and writing to buffer[]. Note that buffer[] is more or less accessed randomly (depending on the order of the values in arr[]). However, there are only 127 positions in buffer that are written to (limited by the size of c[]) and thus we can keep these positions of buffer[] in the L2 cache.

We would expect lines 21-22 to take twice the time than lines 14-17 because there are twice as much memory accesses. However, it takes thrice the time with two threads where we would expect the bus saturation. It gets even a bit faster with more threds although we would expect the bus to be saturated already! What is happening?

The image of modern computers we drew above was not really exact: Modern operating systems use virtual memory with paging to protect applications from each other and the kernel from user land:

Programs use virtual addresses to address their variables and these virtual addresses have to be translated into physical addresses. The data in the cache is addressed physically so access of main memory requires a resolution of a virtual address into a physical address. The addressing is done page wise, e.g. in chunks of 4 KiB. Each of these pages has a virtual base address which has to be mapped to its physical address (the place the page resides in RAM is called page frame).

The operating system has a table for each process that has the mapping from virtual page addresses to physical ones. This table resides in memory, too, and has to be accessed for each memory access. Parts of these tables are kept in a special cache: The so called Translation Lookaside Buffer (TLB). The TLB of the system is again separated into two levels, the faster one is approximately as fast as the registers, the slower one as fast as the L1 cache.

Let us explain our results with these numbers.

Since the page size of the system is 4KiB, we only have to look at the page table every 1024th memory access in lines 14-17. This very few times and we can neglect the access times since they are few and fast (since the L1 TLB is hit).

In lines 25-26, we transfer 128MiB in and out of the RAM. This should take us about 40ms but the lines take use 60ms. However, since access is almost random, we expect to look at the L2 TLB almost every time we want to access buffer[]. This means looking at it 224 times with 1.28ns each. This simplified calculation yields 21ms for the TLB accesses which seems right considered that we will hit the L1 TLB some times, too.

Whee, I do not know about you, but I would like to see a summary of all this to wrap my mind around it properly.

Summary

We examined the parallelization of counting sort, a simple linear time sorting algorithm. The algorithm could be parallelized well but the parallel parts did not yield the expected linear speedup. We considered current, modern computer architectures and could explained our experimental results with the specs of the machine we used and the knowledge of the architecture.

Note, ladies and gentlemen that we are crossing the border between algorithmics and system architecture here: Sometimes, actually implemented algorithms behave different from theoretical results (which indicated a lineare speedup).

So, what's next? We could try to kick our "slow" sorting algorithm into the virtual nirvana and replace it by another one. But which one should we choose? Counting sort needs exactly 4 · n + O(k) operations for an array with the length of n containing values from 0 to k. Any comparison based algorithm like Quicksort would need much more operations and parallelizing them comes at a pretty high overhead. Bucketsort exhibits the same non-locality when copying back elements and Radixsort needs another stable sorting algorithm like counting sort internally. If you, dear reader, know of a better linear sorting algorithm then please let me know since it would solve a problem for me.

We could use a NUMA machine where each processor has its own memory bus and memory. After splitting the input array, each processor could sort its part in its own memory. However, the final result composition would be slower since access to other processor's memory is slow and we have to go through one single bottlenecky bus again.

I hope you had as much fun reading this article as I had analyzing the algorithm and writing the article.

We are looking forward to your comments.

Updates

  • I think that I have not made it clear enough above that the algorithm actually is cache efficient. Everwhere, memory is accessed, it is only accessed ones and in streams (every entry of c points to a part of buffer and this can be considered a stream). Each of these streams is read/written sequentially. This seems to have been hidden by the description of modern computers' architecture above.
 

Header Image

Header Image
Bitwiese Header Image